The University of Queensland Vital Signs Dataset
The patient monitoring data for each case is provided in four different formats:
- Full Data
- Trend Data
- Waveform Plots
- Case Plots
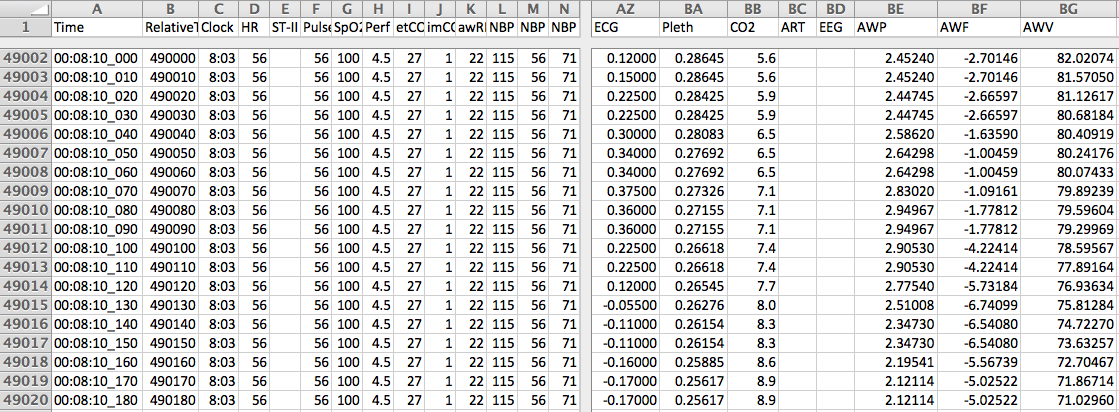
Full Data
Full Data consists of all waveform and numerical parameters plus alarms recorded as
comma-separated values (CSV) text files, where each row represents 10 milliseconds of data.
A full list of the recorded parameters are available on the parameter specifications page.
Each case is split into separate files containing at most 10 minutes of monitoring
data (workaround for the limit on the maximum number of rows in Microsoft Excel, more details here and here).
The following screen capture shows 19 consecutive Full Data samples (representing 190 ms of monitoring data) viewed in Microsoft Excel:
Technical information
The patient vital signs and monitoring data in this dataset were collected from three different sources:
- Philips IntelliVue MP70 patient monitor, plus (depending upon the case) the Anesthetic Gases, Multi-Measurement Server, Spirometry, and BIS modules;
- Philips IntelliVue MP30 patient monitor, plus the Multi-Measurement Server and Microstream CO2 Extension modules; and
- Datex-Ohmeda Aestiva/5 anesthesia machine.
Since the raw data output from each device was provided in various different time and numerical formats,
and the clocks varied slightly between each device, making meaningful comparisons between the data
would have been difficult. For example, the Philips monitors provide ECG waveform samples at 4 ms
resolution, pulse oximetry pleth waveform samples at 8 ms resolution, CO2 samples at 16 ms resolution,
and numerical values at 1024 ms resolution. On the other hand, the Datex-Ohmeda anesthesia machine
provided tidal volume information on a breath-by-breath basis, and ventilation parameters every second.
The data were therefore resampled to 10 millisecond resolution by:
- linearly interpolation to correct for clock skews between the devices,
- cubic interpolation for waveform resampling, and
- no interpolation for numeric/alarm resampling.
The raw, uninterpolated data was not retained in this dataset.
Trend Data
Trend Data consists of all numerical parameters and alarms recorded as CSV text files,
where each row represents 1 second of data.
The following screen capture shows 15 consecutive Trend Data samples (representing 15 seconds of monitoring data) viewed in Microsoft Excel:
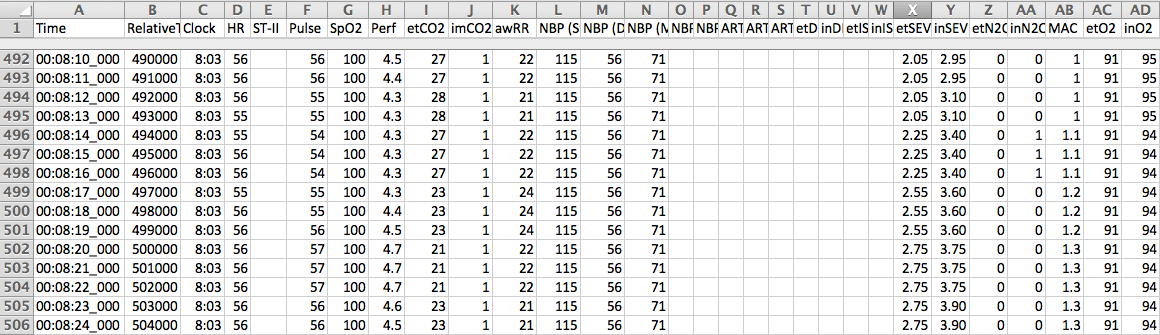
Technical information
The Trend Data were generated by retaining one sample of data (10 ms) per second of Full Data
(100 samples), corresponding to exactly _000 in the milliseconds component of the timestamp, and discarding
the remaining 99 samples. Waveform data columns were also discarded.
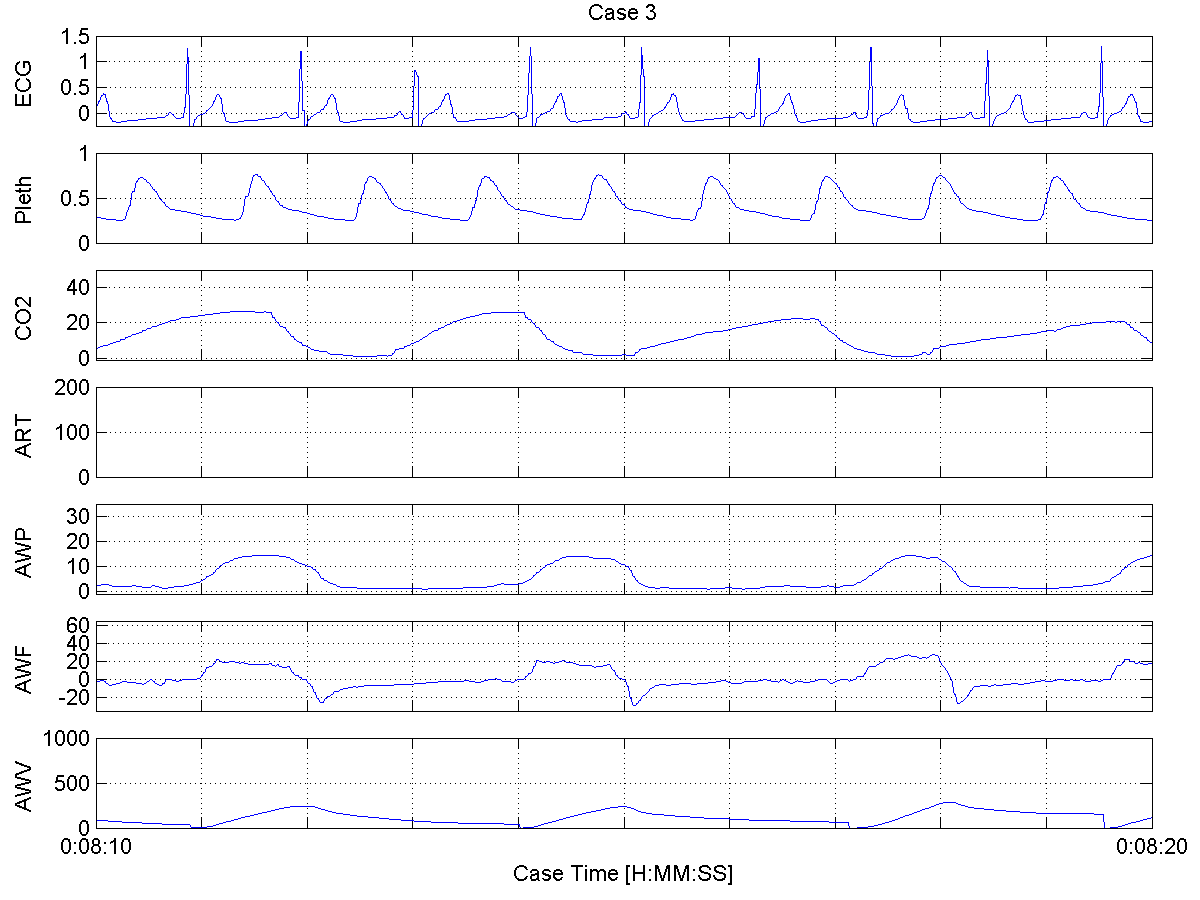
Waveform Plots consist of graphical plots of waveform data as Portable Network Graphics (PNG)
images, in time resolutions of 10 seconds, 30 seconds, 1 minute, 5 minutes,
and 10 minutes of data per image.
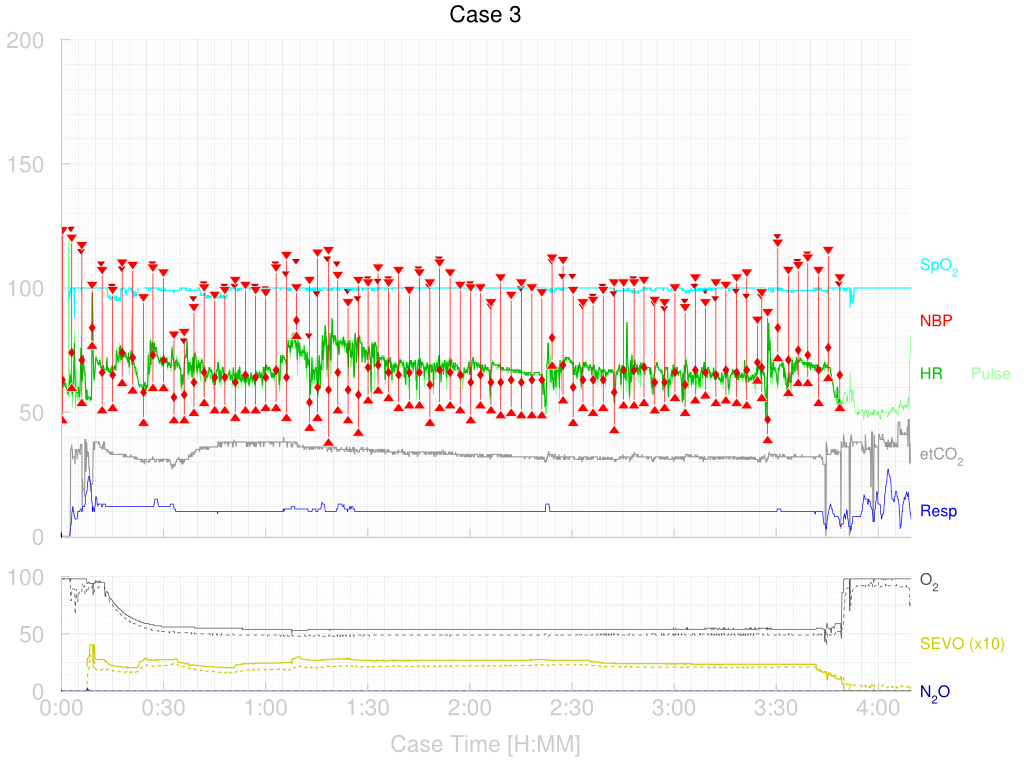
Case Plots
Case Plots are graphical overview plots of numerical data for an entire case in Portable Network Graphics (PNG) (bitmap) and
Scalable Vector Graphics (SVG) (vector) formats.

This work is licensed under a Creative Commons Attribution-NonCommercial 3.0 Unported License.